
How to Analyze Mobile App Performance in Google Play
Google Play is one of the leading digital distribution service providers where app developers can launch their applications. These developers use the platform to provide their users with various tools, programs, and applications to address their multiple needs. However, is it enough for app developers to publish their applications on Google Play? Or should they also monitor their app’s performance to see how they can improve it? Let us learn in this article how Play Console helps analyze mobile app performance.
How to Use Google Play Console
To use Play Console and analyze your mobile app performance on Google Play, you must first register for a Google Play Developer account. After that, you can use your Google Account to sign up. After registering for a developer account, you can use Play Console to publish and manage your mobile apps.
Play Console will then ask you to review and accept the Google Play Developer Distribution Agreement in the sign-up process. Also, take note that there is a US$25 one-time registration fee that you will need to pay to continue creating your developer account.
After that, you will need to fill out your account details, including your “Developer name,” your physical address, and your contact information.
The Google Play Console Interface
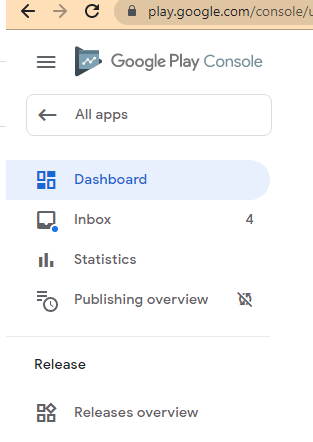
Once you have set up and verified your developer account, you can then head to Play Console and select an app that you have previously published on Google Play. There, you will find your app’s Dashboard, Inbox, Statistics, and Publishing Overview.
The Dashboard will guide you through all of the essential steps you need to follow to publish your mobile app on Google Play. It will also display particular metrics, trends, notifications, and insights to help you monitor and analyze your mobile app performance after successfully launching it on Google Play.
Under Statistics, you can view and customize detailed reports and analytics on your mobile app performance. It displays metrics in its “App statistics” tab and “Compare to peers” tab.
Finally, in the Publishing Overview, you can see the modifications you have made to your app. You can also control when you need to publish your app updates.
Google Play Console Metrics
Here are the metrics provided by Google Play Console to help you monitor and analyze mobile app performance:
Install-related statistics
- Users
- Active users
- User acquisitions
- User loss
- New users
- Returning users
- All users
- Devices
- Active devices
- Device acquisition
- Device loss
- New devices
- Returning devices
- All devices
- Device updates
- Device loss after update
- Install events
- Uninstall events
- Daily Active Users (DAU)
- Monthly Active Users (MAU)
- Monthly returning users
- Store listing acquisitions
- Store listing visitors
Ratings
- Average rating
- Ratings volume
- Cumulative average rating
- Google Play rating
Revenue
- Revenue
- Total revenue
- Buyers
- New buyers
- Cumulative buyers
- Average revenue per Daily Active User
- Average revenue per Monthly Active User
- Purchases per Daily Active User
- Purchases per Monthly Active User
- Purchases per daily buyer
- Purchases per monthly buyer
- Daily buyer ratio
- Monthly buyer ratio
- Daily average purchase value
- Monthly average purchase value
Crashes and application not responding errors (ANRs)
- Crashes
- ANRs
Android Instant Apps
- Launches by device
- Launch events
- Conversion events
How to View App Statistics on Play Console
In Google Play Console, you can monitor, review, and analyze mobile app performance through the Dashboard and the Statistics pages. As mentioned, the Dashboard page provides you with an overview of the key metrics, insights, trends, and notifications on your mobile app performance. Moreover, the Statistics pages show a detailed report on the key metrics under its App Statistics tab and Compare to peers tab.
The Dashboard Page
So that you can see your mobile app’s dashboard, head to Google Play Console and select said app. Then, on the left menu, click on Dashboard.
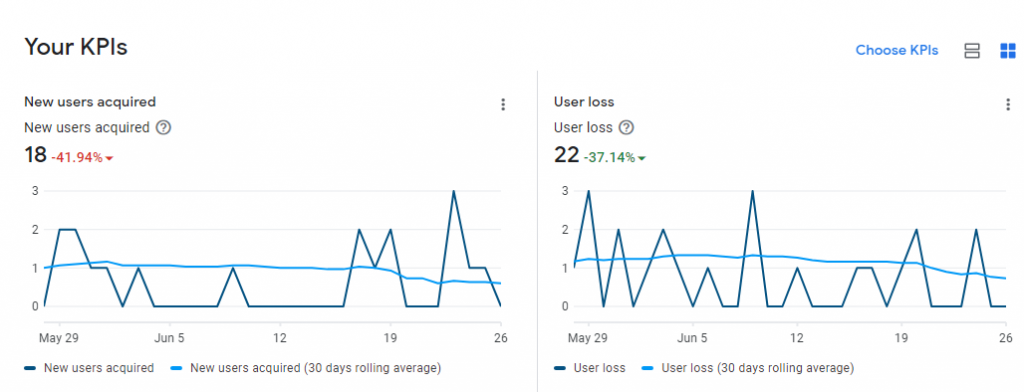
In the Dashboard, you can find various sections that display updated information on your mobile app performance and key insights by set periods. In addition, you can click the expand and collapse button located at the top right of each section to reveal more information on the performance of your mobile app.
Please note that you can view more details on a specific metric by hovering on the question mark icon beside it.
The Dashboard page also allows you to customize the KPIs of your mobile app. On the Dashboard page, scroll down to the section labeled “Your KPIs” and click on “Choose KPIs.” You can then browse through the “All available metrics” section to see your KPIs. Here, you can create your own KPI or choose from the ones already provided, including user growth and loss, device growth and loss, store listing performance, engagement, quality, and other dashboard cards.
To pin a particular metric on your dashboard, you can click on the “+ Add to KPIs” button. In doing so, you can customize its KPI name and its dimension. Then, in the “Selected KPIs” section, you can arrange your KPIs by dragging and dropping.
The Statistics Page
With the Statistics page, you can understand your mobile app performance better. On this page, you can compare metrics, choose custom date ranges, and see data according to their dimensions. On the Statistics page, you can also compare the growth rate metrics between peer groups on Google Play to see the performance of your mobile application.
How to Set up your Report
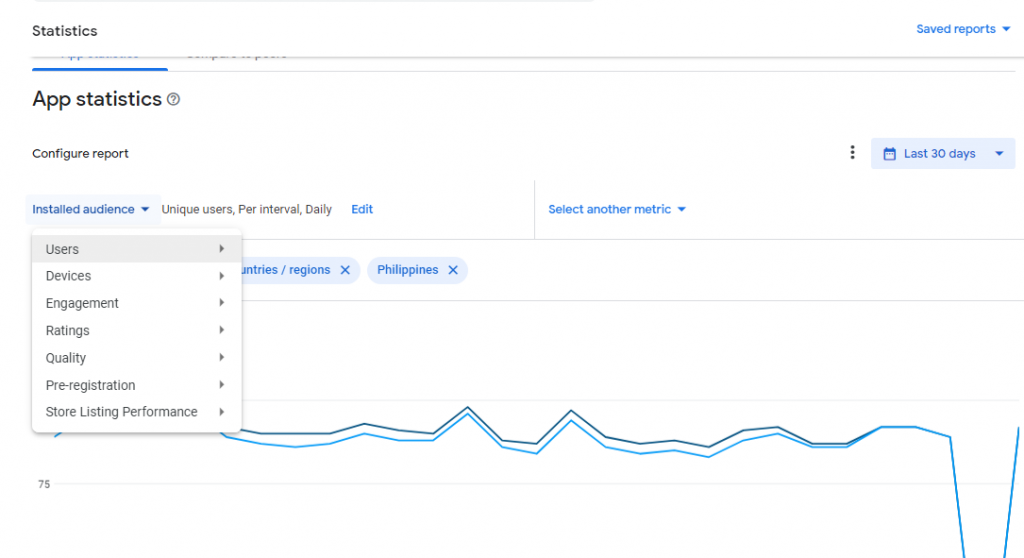
So that you can better analyze your mobile app performance, you need to set up your reports. First, on the Statistics page, click on the App statistics tab to see your app’s absolute performance. However, if you want to see your app’s normalized metrics and benchmarks, click on the Compare to Peers tab. Then, choose the date range that you wish to view and analyze at the upper right corner of your screen. After that, select the metric you want to view by clicking the blue down arrow button found in the “Configure report” section.
Once you have chosen the date range and the metric you want to view, you must define how the metric has to be calculated and displayed on your report. For instance, under Event type, you can choose “All events” to calculate every time users install your mobile app. You can also select “Unique” to calculate the number of unique users or devices that installed your mobile app.
You can then use the Metric calculation to specify how you want to calculate the data selected. Here, you can choose “Per interval” to calculate the data collected in every time interval, such as the number of users who installed your mobile app for the first time every month. You can also choose “30-day rolling average” to calculate the data collected from the last 30 days.
Lastly, you can use Time intervals to specify the period from which you collect and calculate data. Time intervals include hourly, daily, weekly, monthly, or quarterly.
Additionally, if you want to create a second metric to compare to the one you just made, you can click on the Add a metric button. Then, click the down arrow button to select the dimensions you want to apply to said metric.
How to Select your Dimensions
When you have finished setting up your report, Play Console will display a table and a chart to show your mobile app’s performance for the particular period you selected.
You can find the following dimensions on the Statistics page: android version, device, country, language, carrier (when applicable), channel, and app version.
How to Save, View, and Export Quick Reports
After setting up a report’s metrics and dimensions, Google Play Console allows you to save said report to reuse it later. To do this, under the date range for your report, you can select the “Save to quick reports” button. You also need to add a title for your quick report. To view your quick reports, you can select Quick reports then click on the Saved reports button.
If you want to export your quick report, you can do so by clicking on the Expert report button beside the chart’s title. Doing so will allow you to export the said report as a CSV file.
Analyze Mobile App Performance with Play Console
With Play Console, you are now equipped with the right analytical tools to determine the performance of your mobile app on Google Play. Now, you can identify which areas in your campaign need improving to guarantee an increase in app downloads and installations by your users.
So, if you still need help managing your marketing campaigns and analyzing your mobile app performance, it would be best that you tap on a digital marketing company in the Philippines to help you along the way!
Do you have any questions about Google Play Console and how it helps analyze mobile app performance? Let us know in the comments section below!











Comment 0